


For Week Ending October 28, 2017
The national unemployment rate registered in at 4.1 percent for October 2017. To put that in perspective, joblessness has not been this low in the U.S. since December 2000. In other positive economic news, mortgage rates have been holding steady at or near 3.9 percent. Historically, the average rate has been around 6.0 percent. Factors such as these keep the pool of potential buyers full, even during the so-called off-season of residential real estate sales.
In the Twin Cities region, for the week ending October 28:
- New Listings increased 2.7% to 1,076
- Pending Sales decreased 2.2% to 1,001
- Inventory decreased 16.4% to 11,932
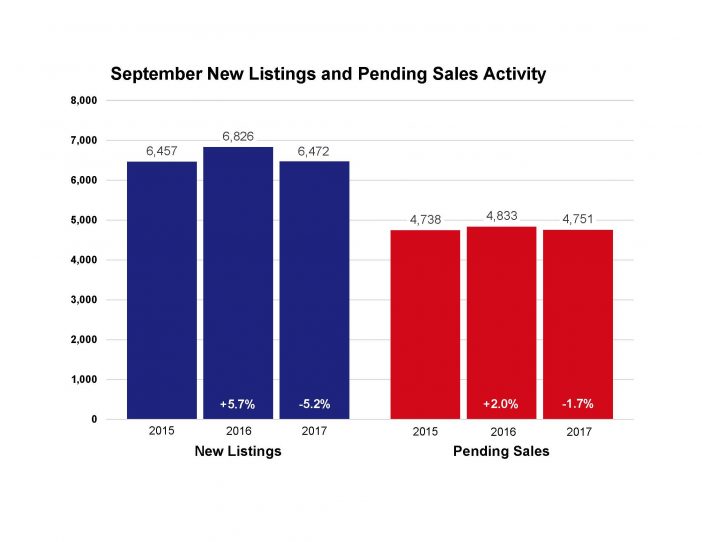
For the month of September:
- Median Sales Price increased 7.4% to $247,000
- Days on Market decreased 12.3% to 50
- Percent of Original List Price Received increased 0.6% to 98.1%
- Months Supply of Inventory decreased 16.7% to 2.5
All comparisons are to 2016
Click here for the full Weekly Market Activity Report. From The Skinny Blog.